Dashboard
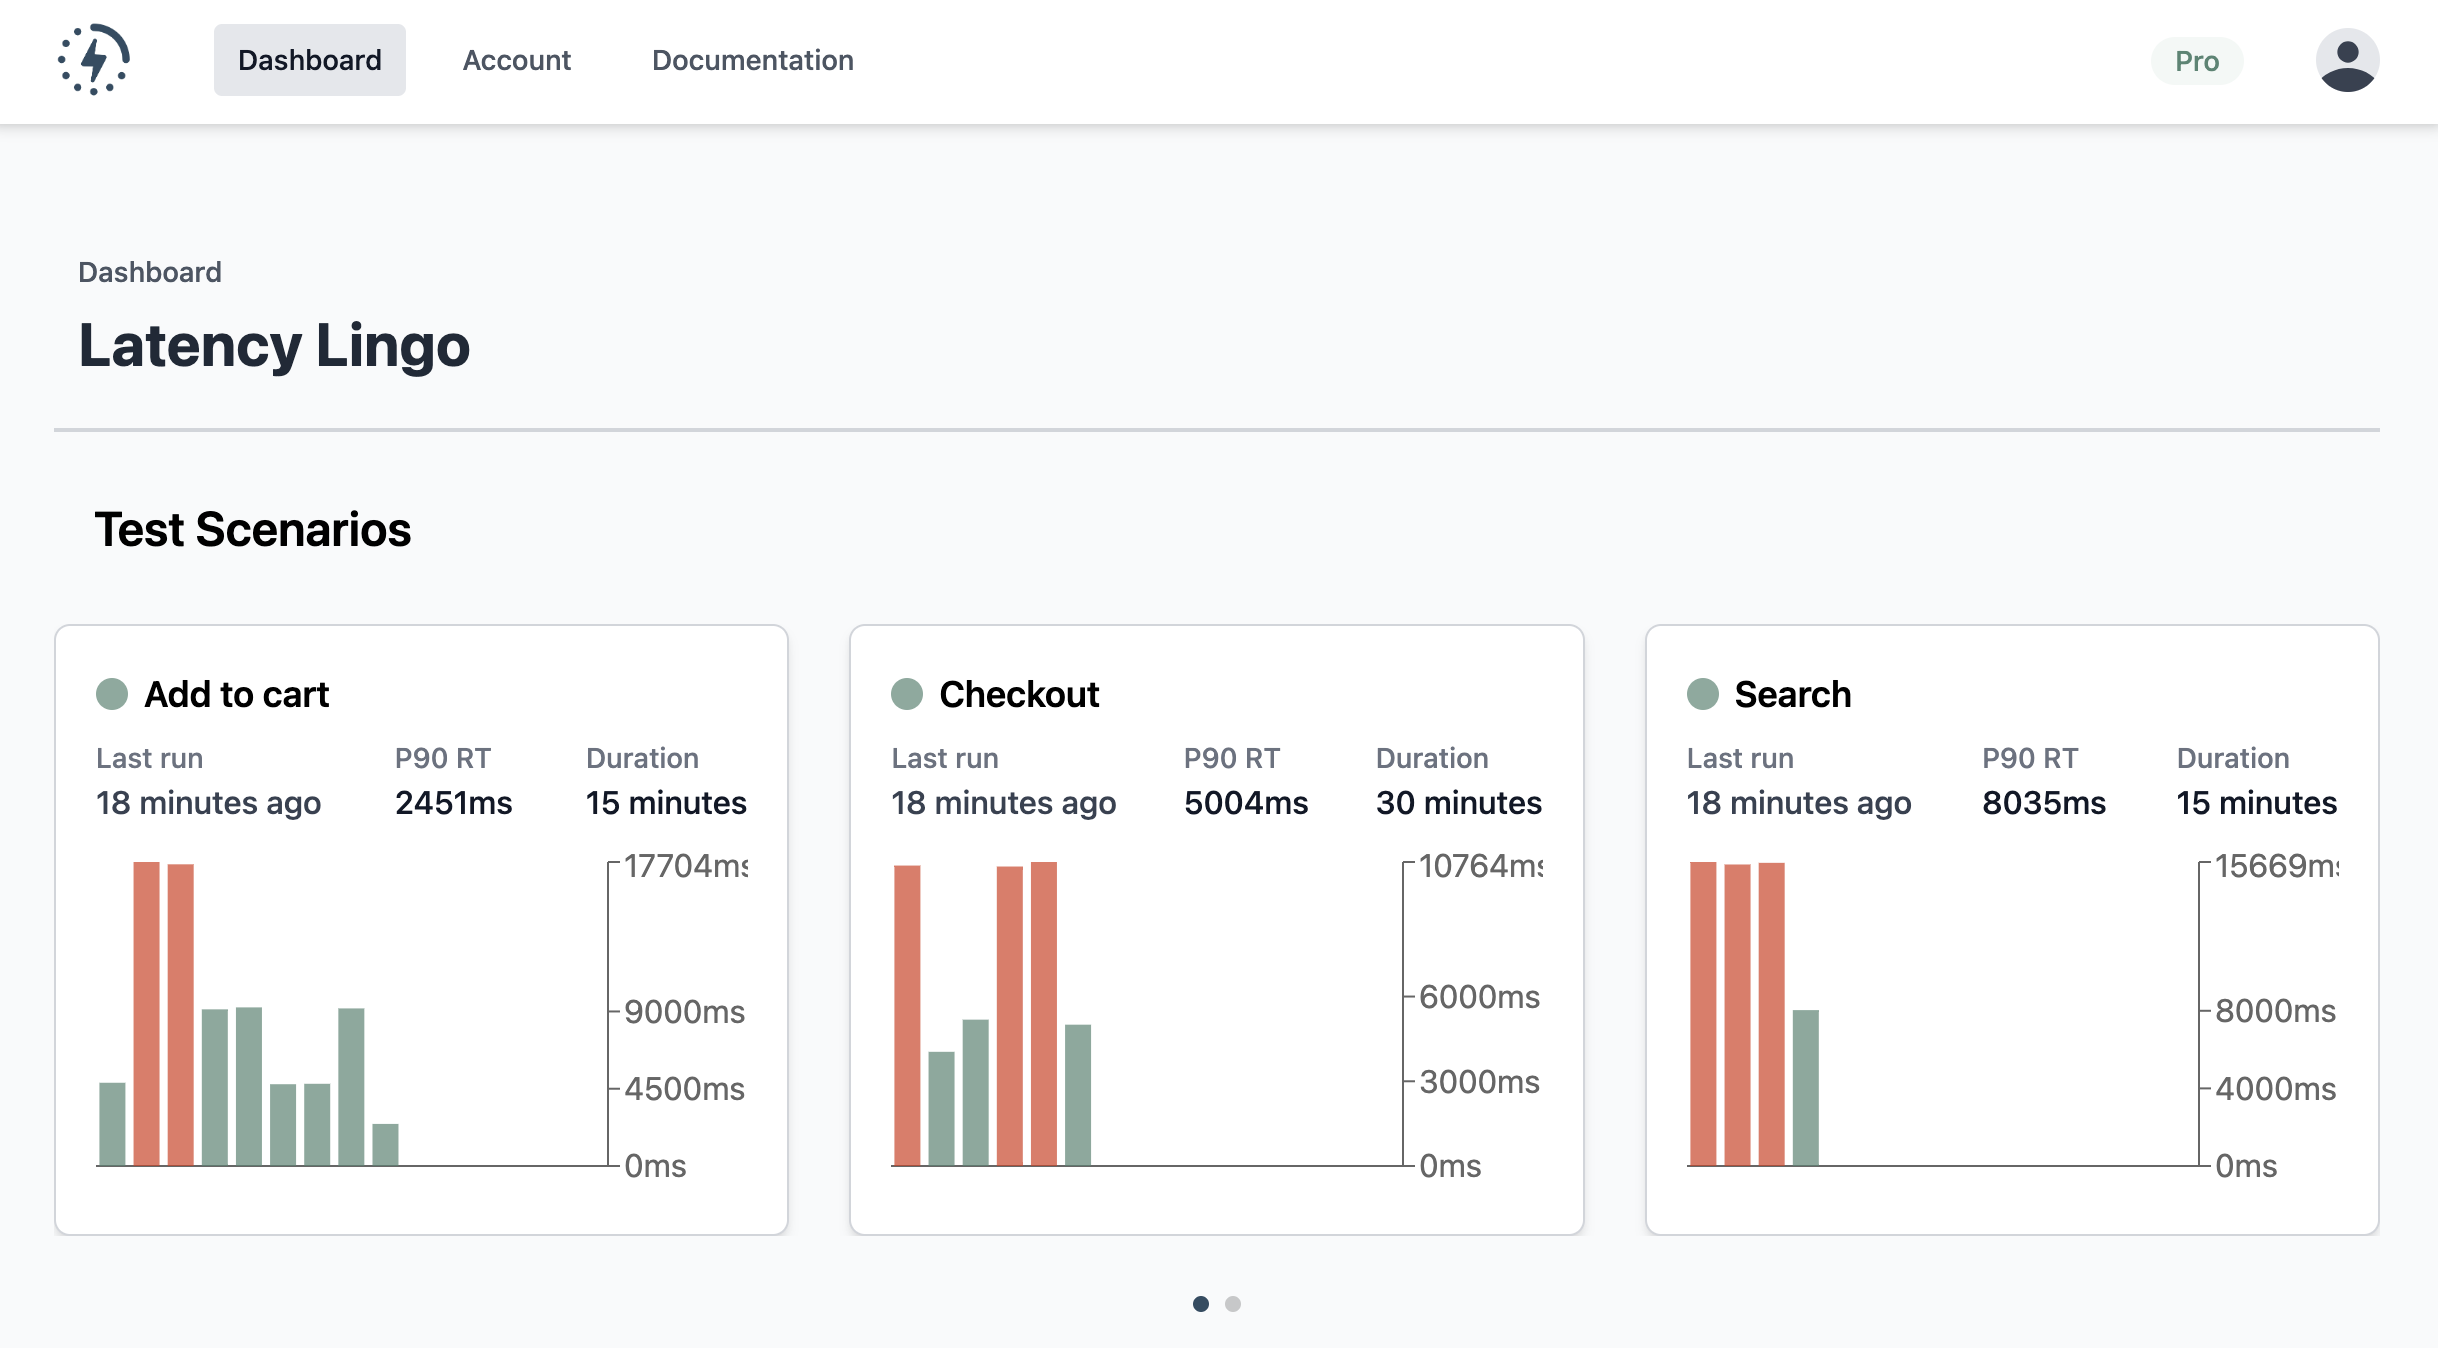
The dashboard is the overview to all test runs published by your team.
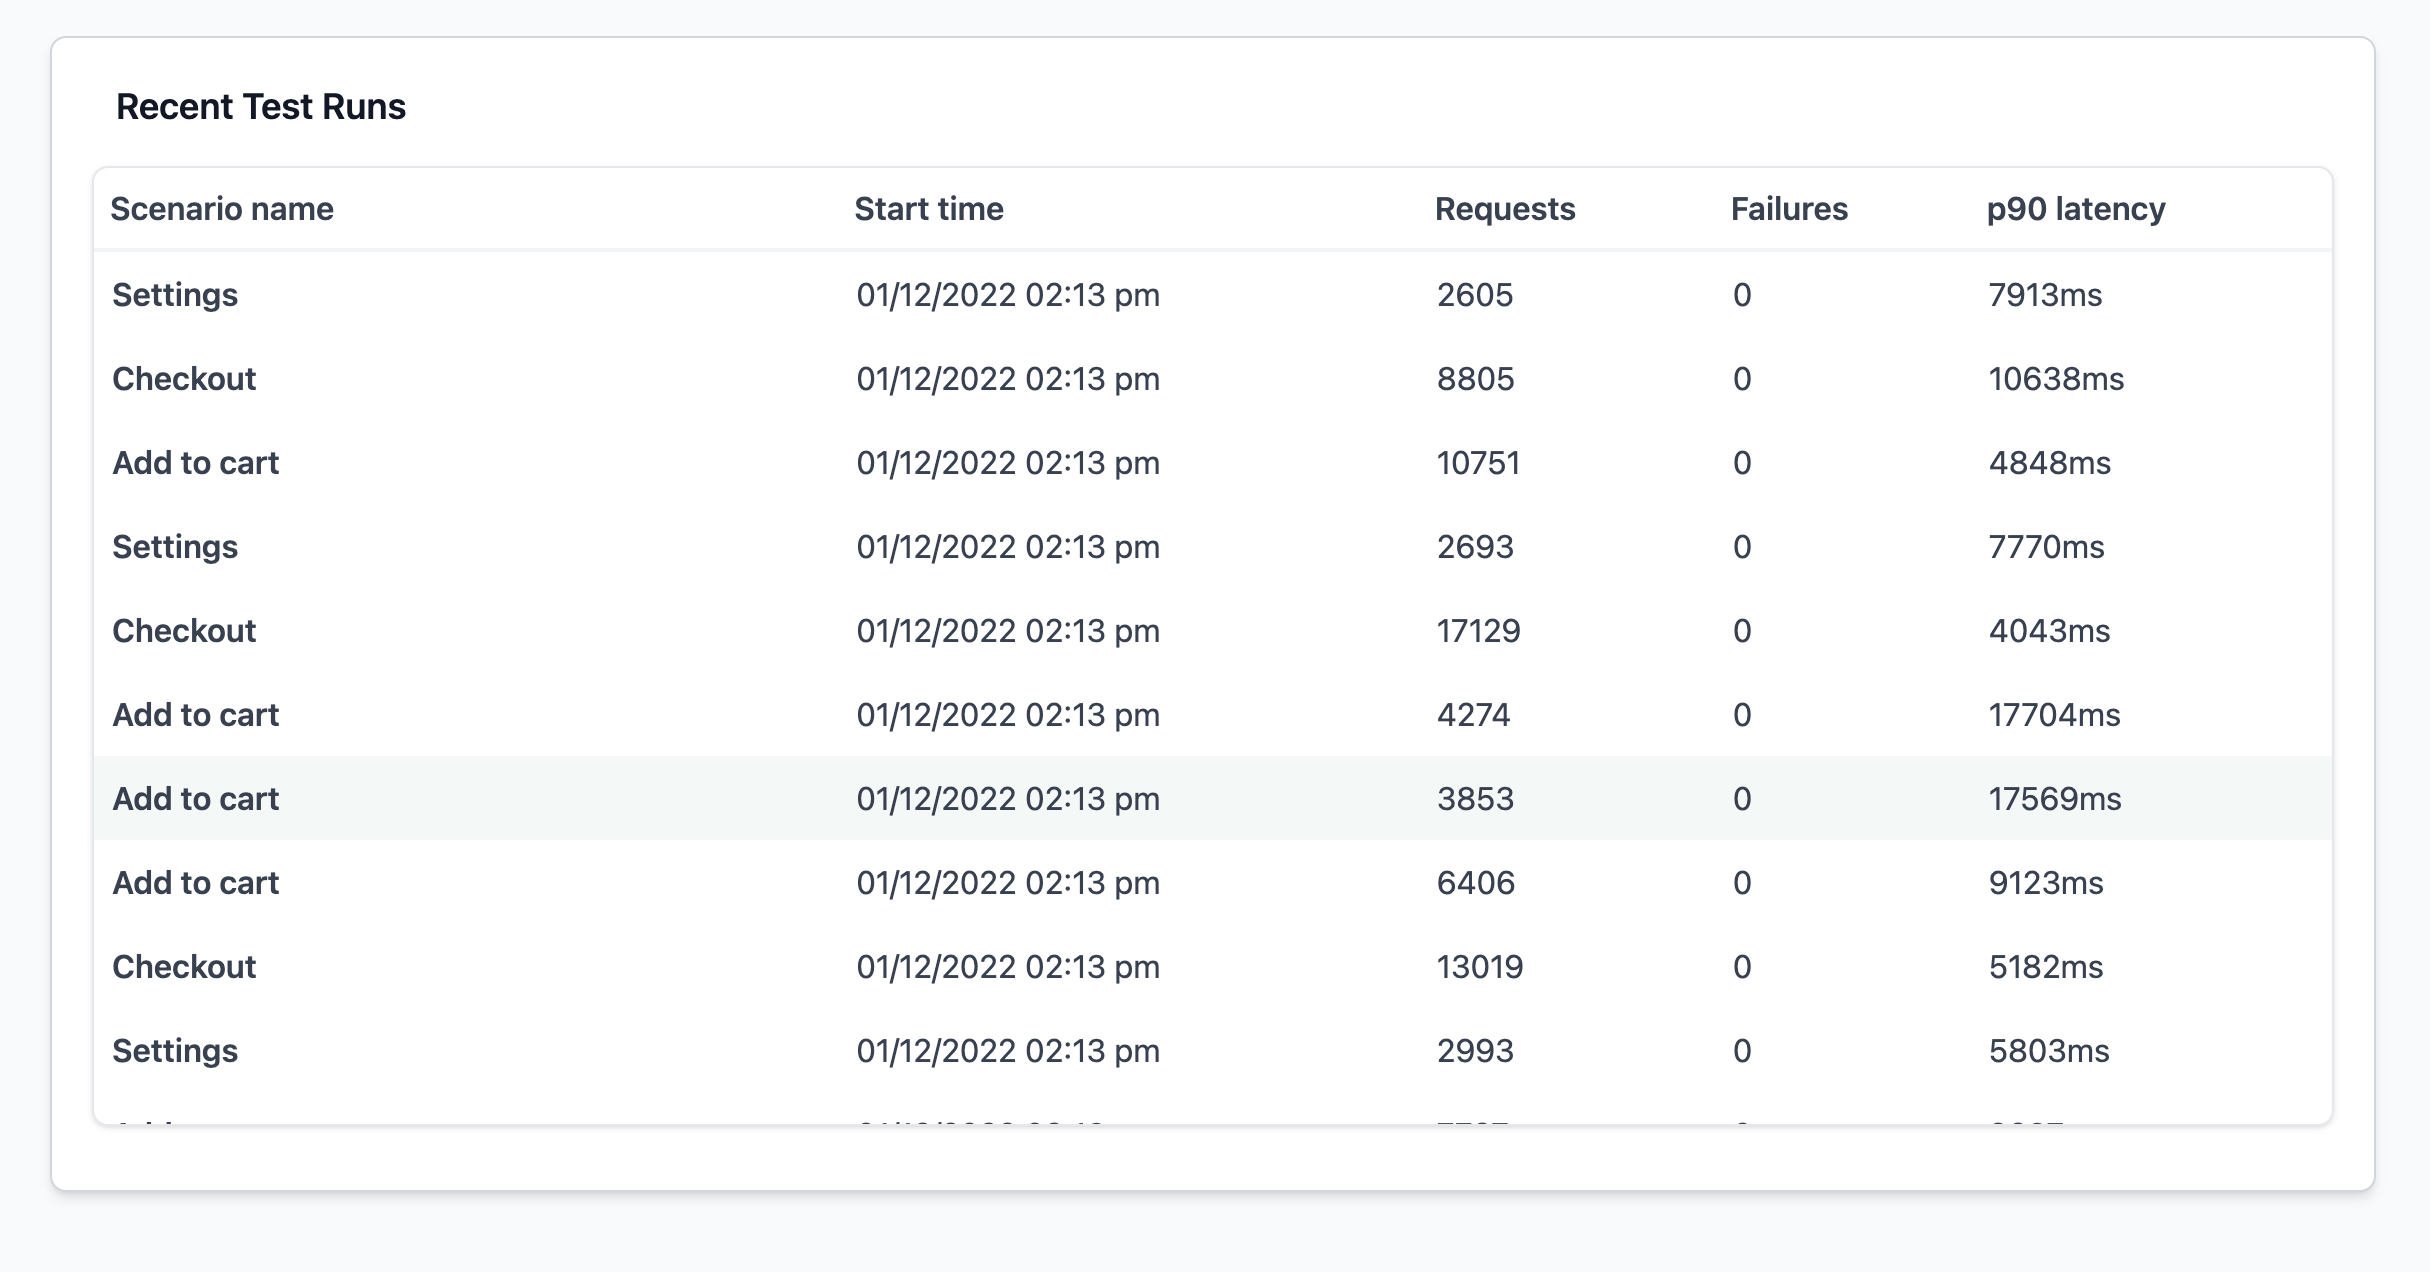
Tests are grouped by their test scenario. Each scenario includes a chart to show p(90) response time trends over the last 15 runs. You can click on each data point in the chart to see the test run details.
For test scenarios that have thresholds configured, each data point will be color-coded with the build status for that test run.
https://latencylingo.com/dashboard