Test Runs
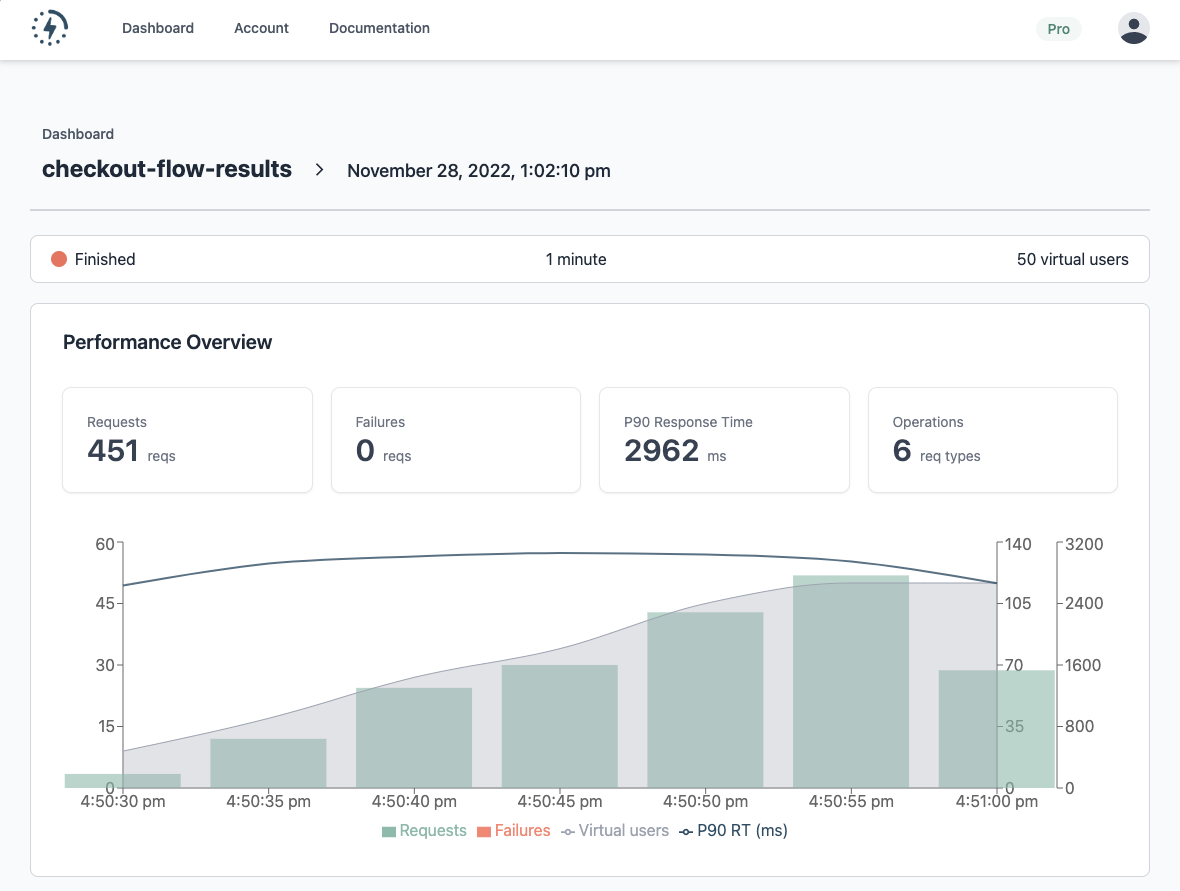
Test runs are where you analyze the results of each performance test. You can view information of the test scenario and various metric views to help you understand the results.
Explore Panel
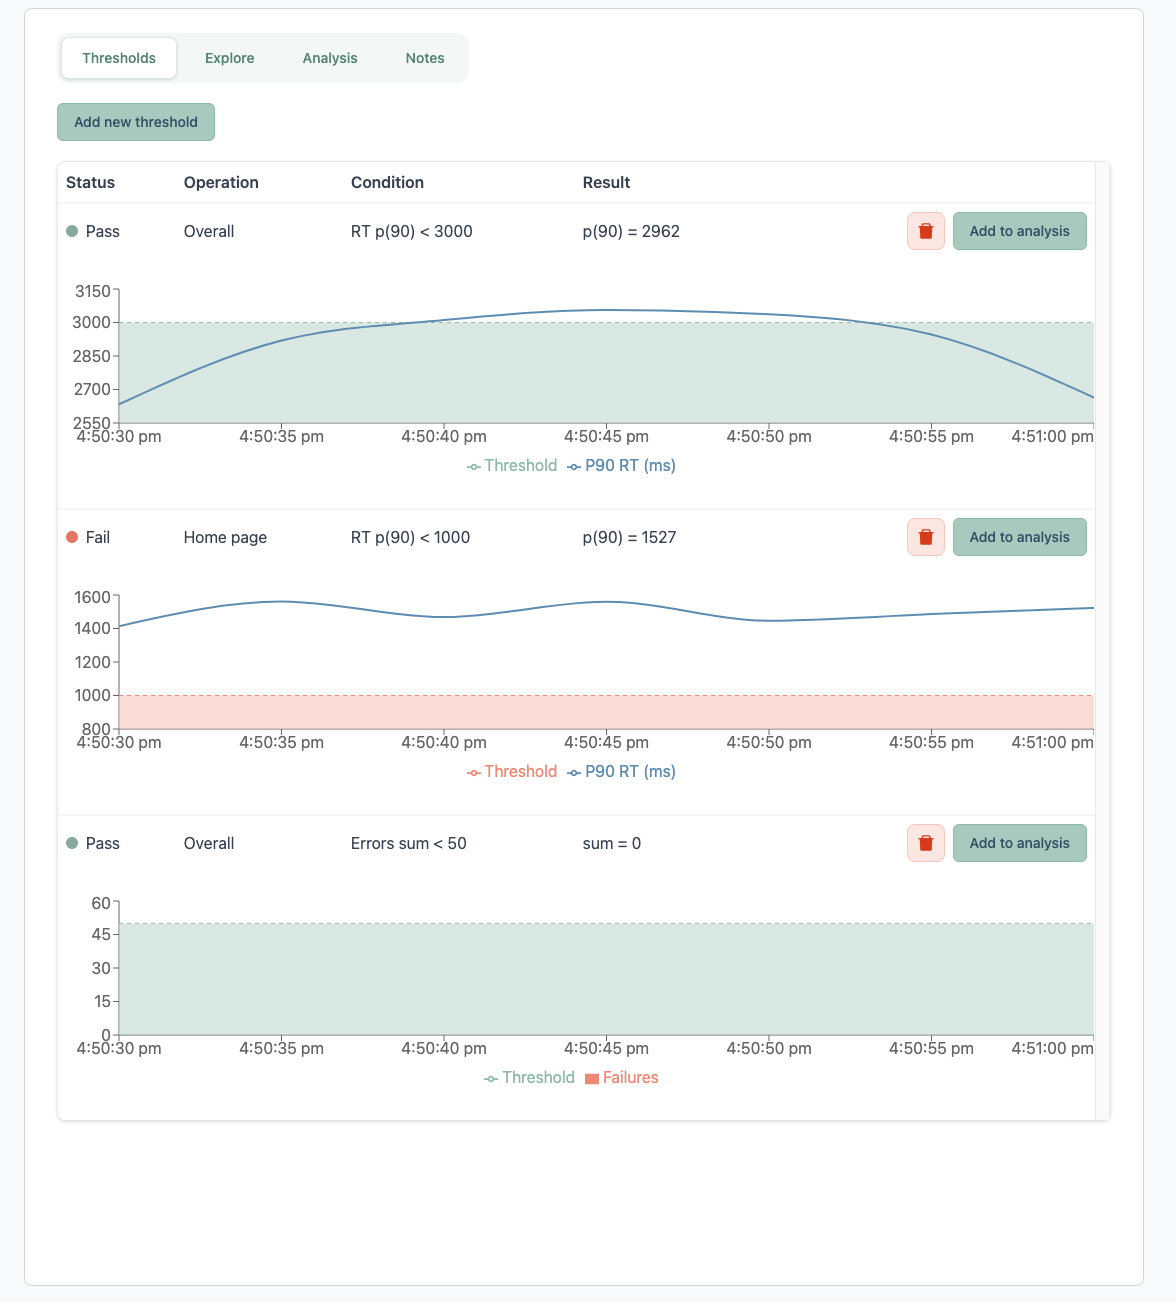
In the Explore panel, you can view metrics grouped by operation. Each row can be expanded to use the chart explorer for deeper analysis across different metrics. The explorer currently supports the following metric views:
- Performance overview
- Request count
- Response time breakdown
All charts can be pinned for analysis.
Thresholds Panel
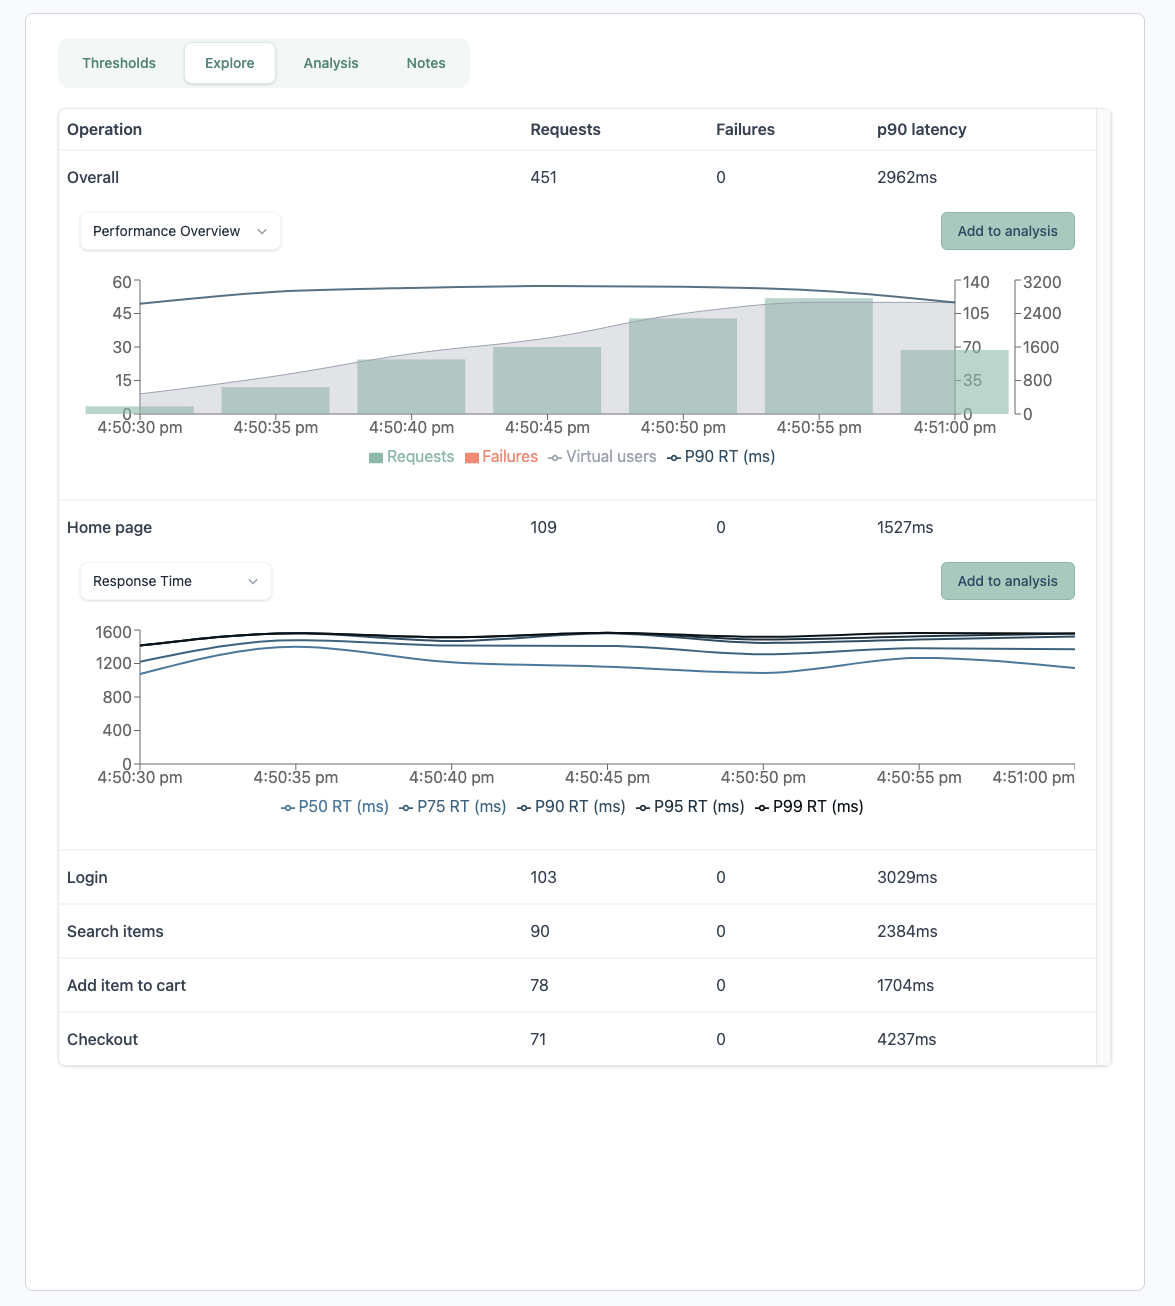
This is where you can view and define all thresholds for this test scenario. Thresholds are used to measure against some service-level objective or to ensure that the performance of a service is not regressing.
An example threshold would be to assert that response time at p(90) is less than 100ms for all requests in the test run.
Each threshold row can be expanded to view a chart representing the threshold condition and result. These charts can be pinned for analysis.

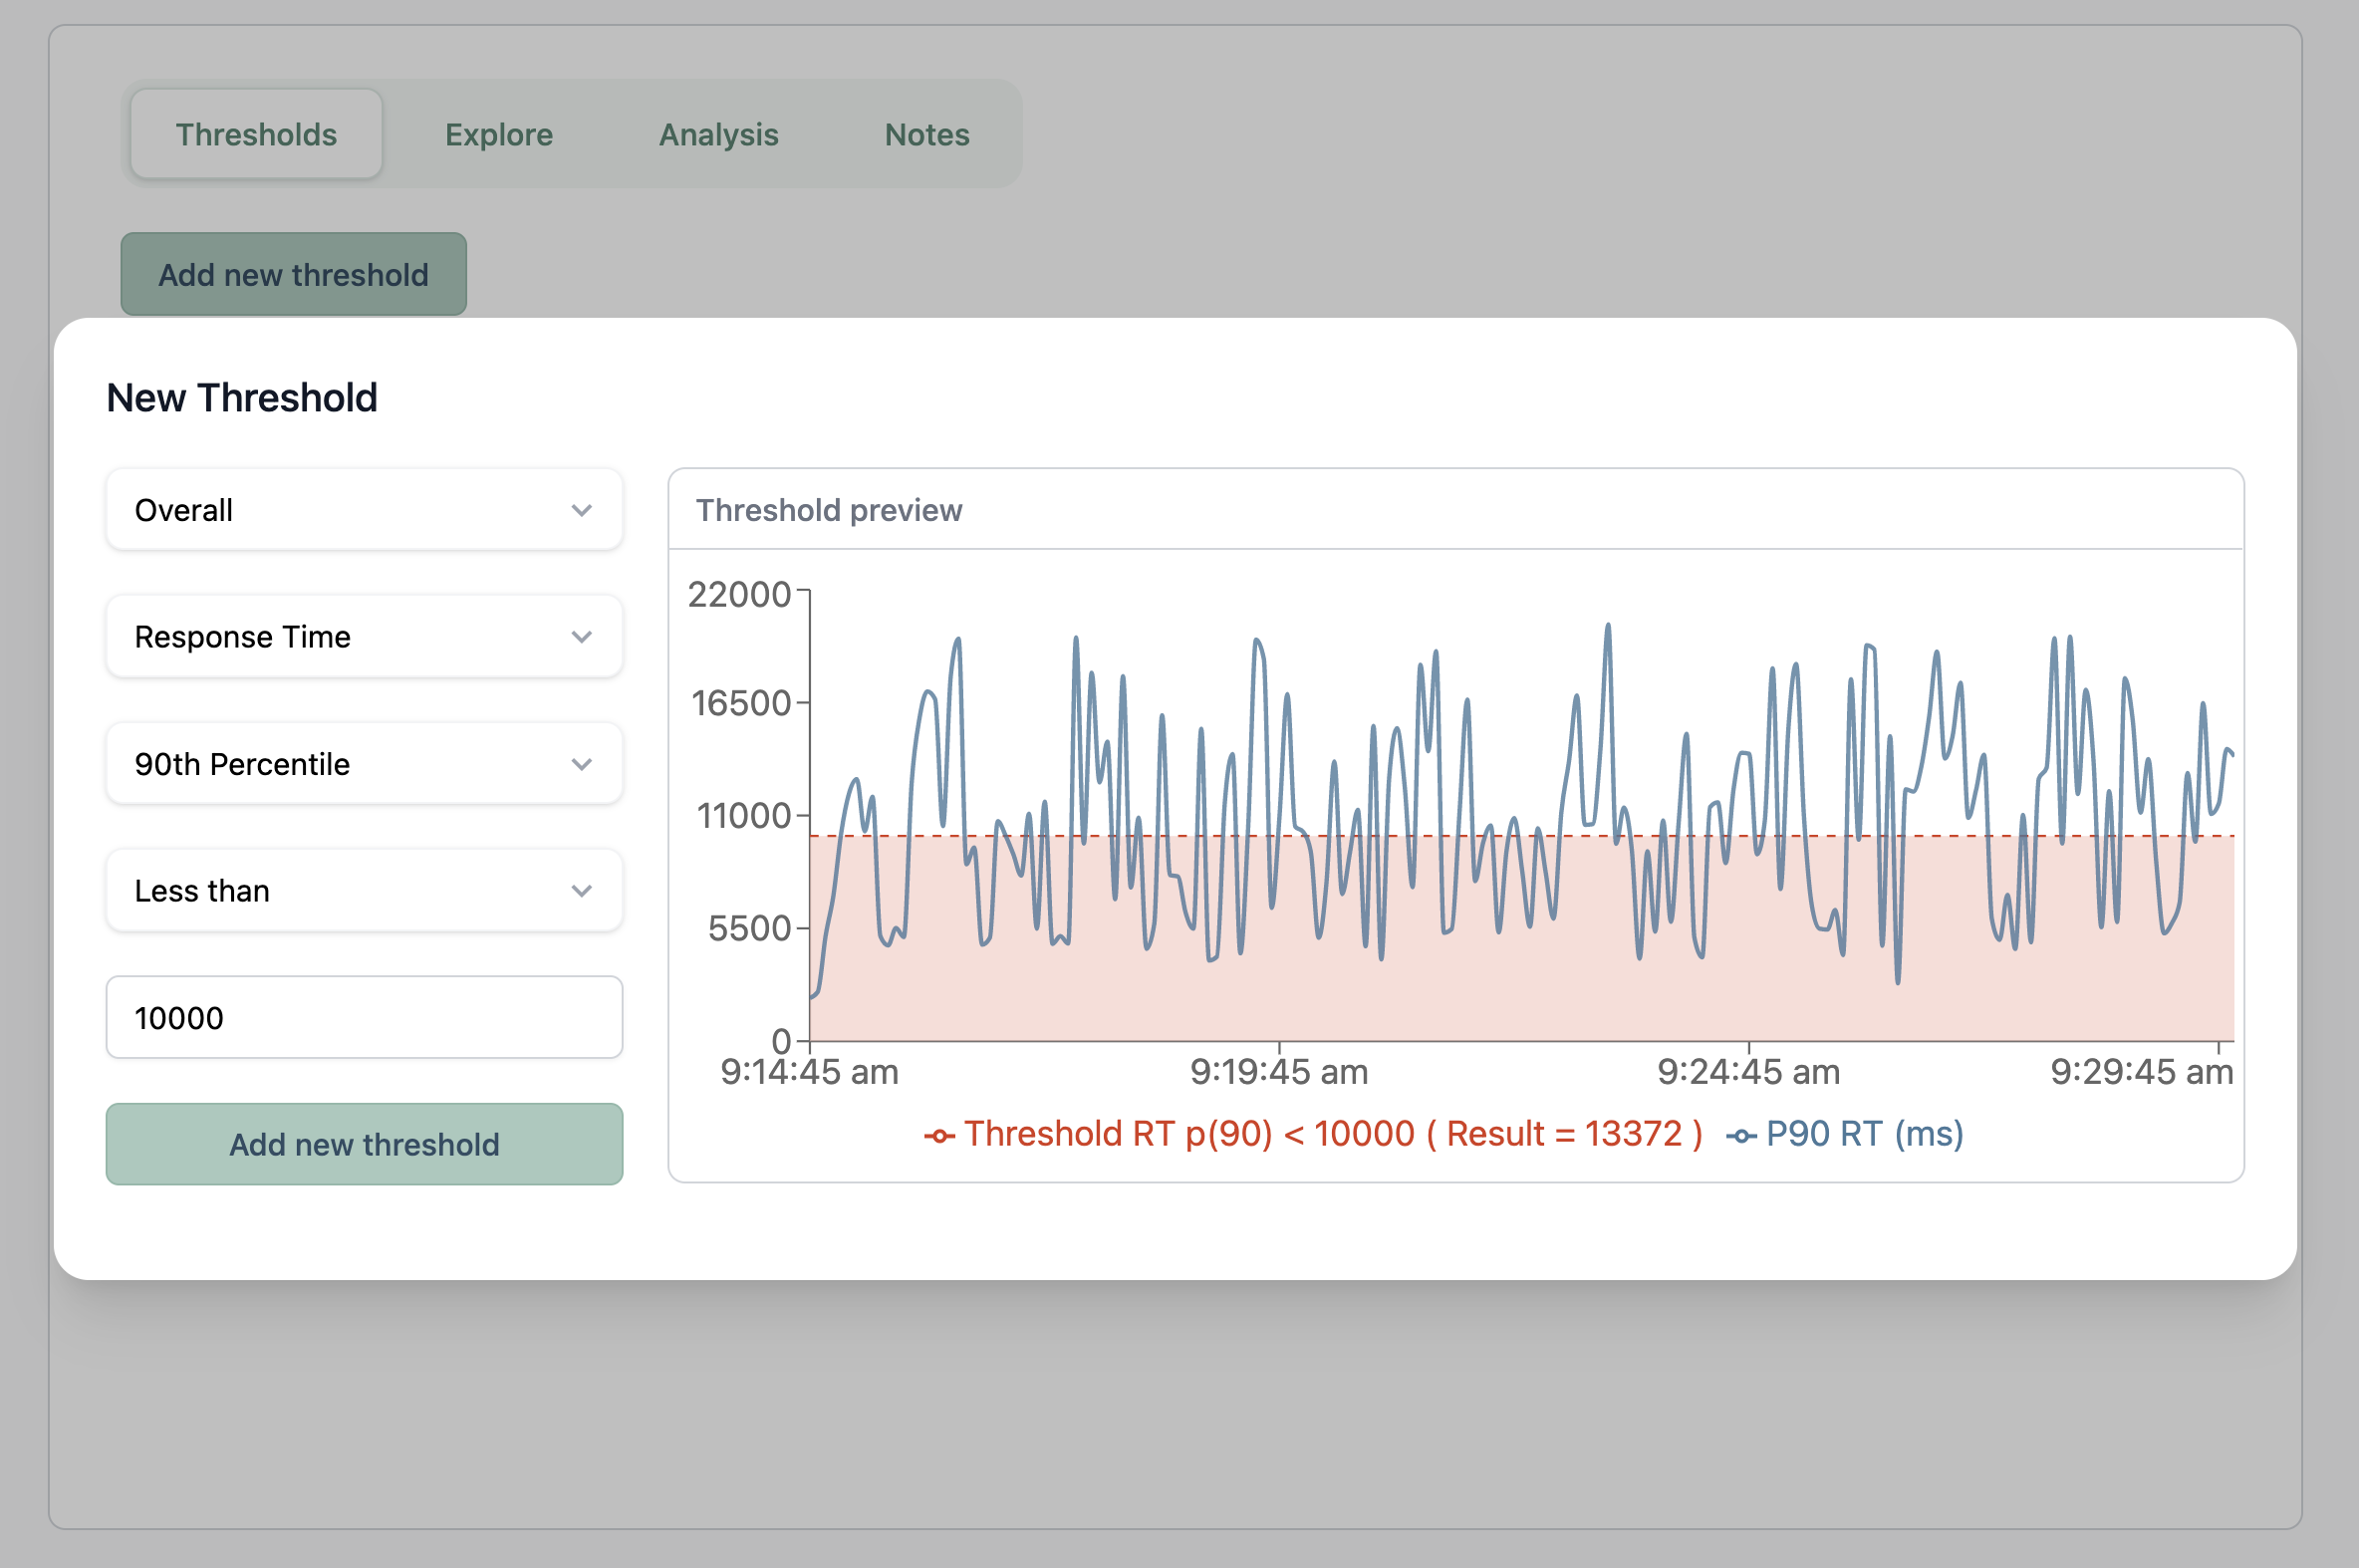
Use the "Add new threshold" button to add a new threshold. These thresholds apply to all test runs in this test scenario. A preview of the threshold condition and result will be displayed once fields are filled out.
Analysis Panel
All pinned charts will be displayed in the Analysis panel. Charts can be pinned from the Explore panel or the Thresholds panel.
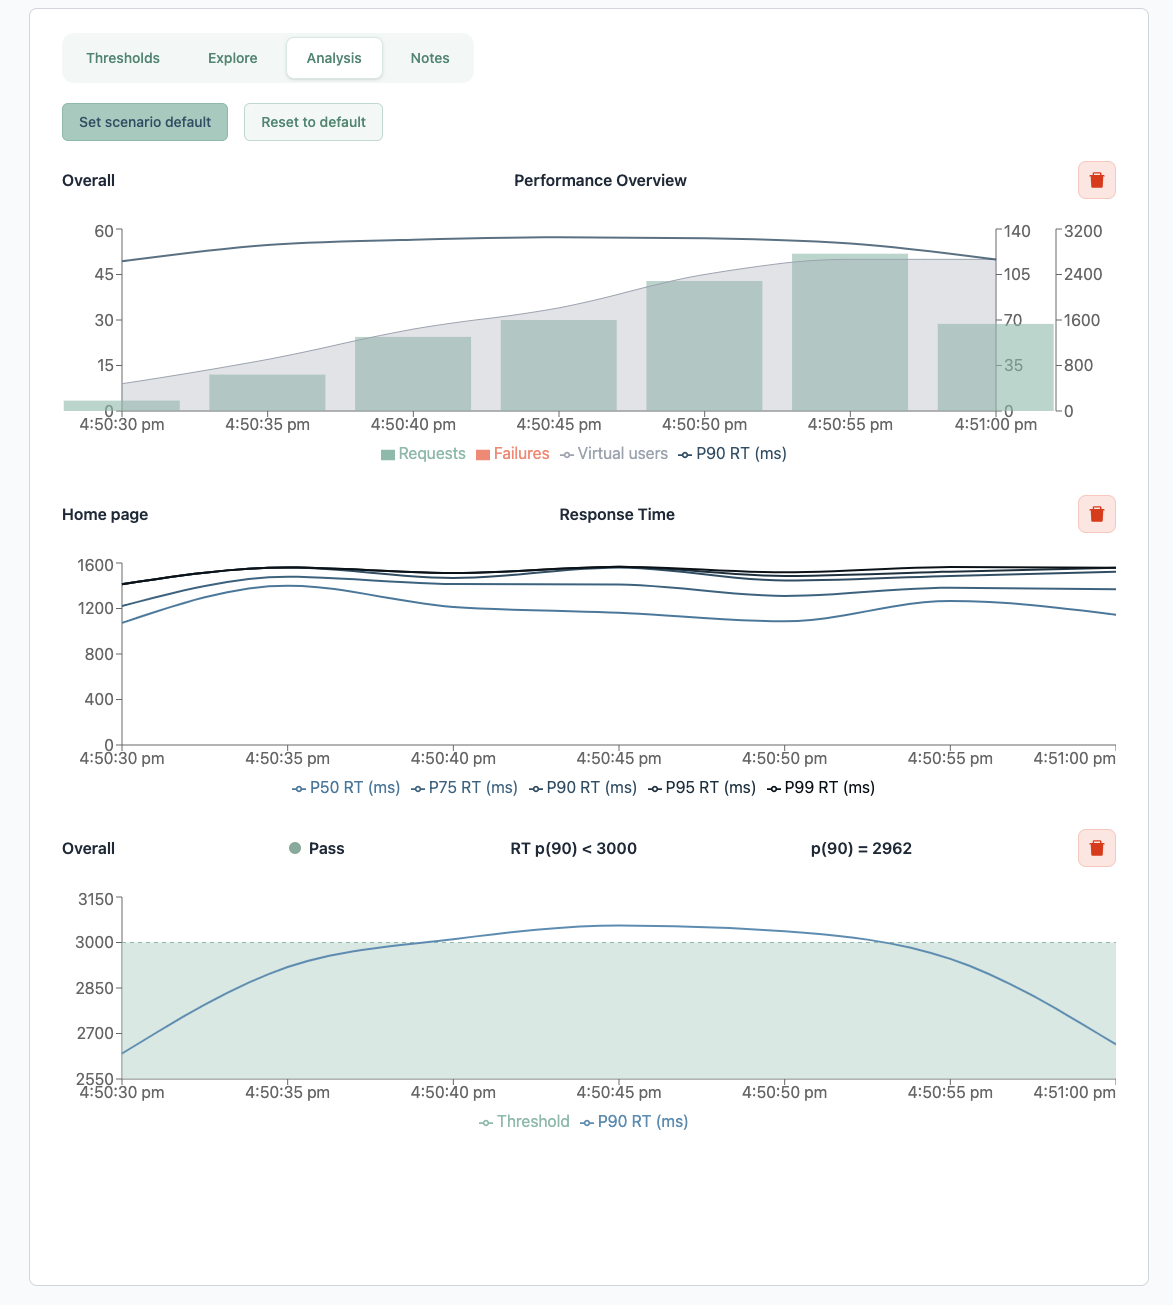
Analysis charts are initially only applied to this test run, but you can set them to apply to all test runs in this test scenario by clicking the "Set scenario default" button. This will apply these analysis chart settings to all current and future test runs in this scenario.